This lesson is picked from Next.js source code. In this article, you will learn the overview of OpenTelemetry and where to find the code related to OpenTelemetry in Next.js source code.
What is OpenTelemetry?
OpenTelemetry is a tool that helps keep an eye on how software is running by collecting important information like traces (how requests move through the system), metrics (performance data), and logs (recorded events). It can work with many different monitoring tools, whether they’re free and open-source like Jaeger and Prometheus or paid services.
You can read more about What is OpenTelemetry from the official documentation.
I found the following important concepts from the documentation to understand the basics of OpenTelemetry:
Practice the exercises based on documentation to become an expert in Next.js
It also has vast APIs and SDKs supported supported in many different programming languages.
Two key principles:
You own the data that you generate. There’s no vendor lock-in.
You only have to learn a single set of APIs and conventions. — Source
How Next.js uses OpenTelemetry?

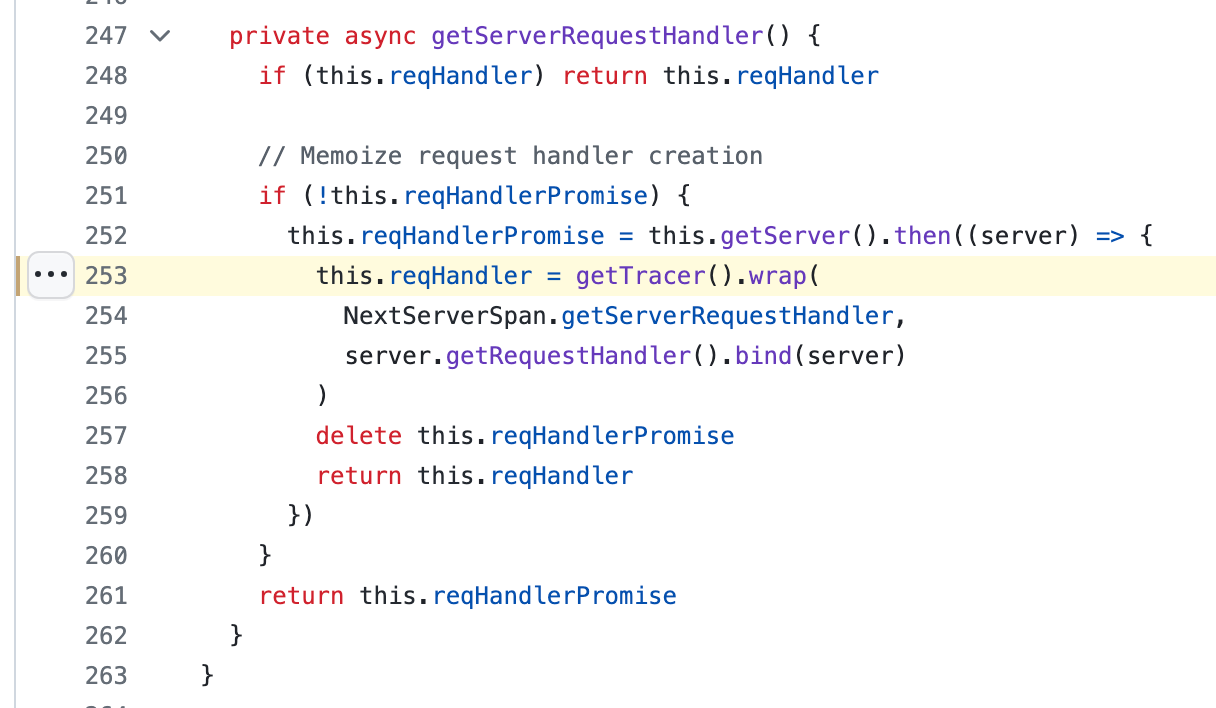
You can find the OpenTelemetry related code in the file named tracer.js inside packages/next/server. I can see that trace is used to get the big picture of how the system works inside the server folder.
An example Next.js with OpenTelemetry configured
Next.js provided an example with OpenTelemetry
Conclusion:
This one time I saw the OpenTelemetry on the Github “Trending” page (I try to visit the “Trending” page on Github to see what’s popular among the dev community for the day). At that time, I did not know Next.js uses OpenTelemetry for tracing purposes in their server related code. WIth OpenTelemetry, you can understand your system from outside and also, you own the data that you generate. Application must be properly instrumented to troubleshoot and handle novel problems.
